What is GTmetrix?
GTmetrix is an extremely popular and free page speed and performance analysis tool developed by the nice folks at GT.net, a web hosting company based in Vancouver.
It combines the best of Google’s PageSpeed tests with Yahoo’s YSlow scoring matrix.
What’s made this tool so popular is that it provides a wealth of graded data on exactly what’s causing your site speed issues.
And it does this in a far more practical and visual way than the equally popular Google Pagespeed Insights tool.
Plus there’s the added bonus that GTmetrix also fully interacts with WordPress via their plugin, available from the WP repository.
So you can do speed tests without ever having to lease your WordPress dashboard:
The issue with these speed analysis tools however is that the results they return are often a bit cryptic and not very clear.
So in this post, my goal is to identify the most common issues that could appear when you use GTmetrix and tell you what they mean and what to look into to fix them.
This way, you can DIY speed your site up, even if you are no nerdy tech person.
Setting Up The Perfect Test
We also strongly recommend creating a free account on GTmetrix if you want to make the most of this tool.
You don’t need to provide payment info, so there’s no excuse for not registering.
Oh, and it’s also really important if you want to correctly set the parameters for your test.
Test Server Location
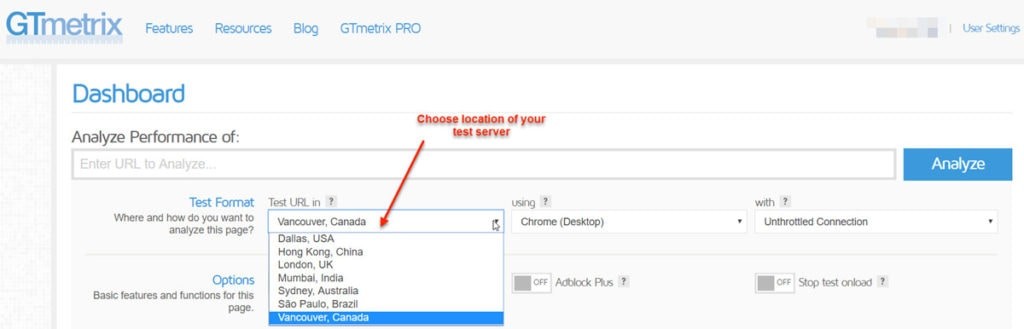
Choose the server that is the closest geographical match to your own.
This will give you an accurate representation of real user experience based on localized page speed scores.
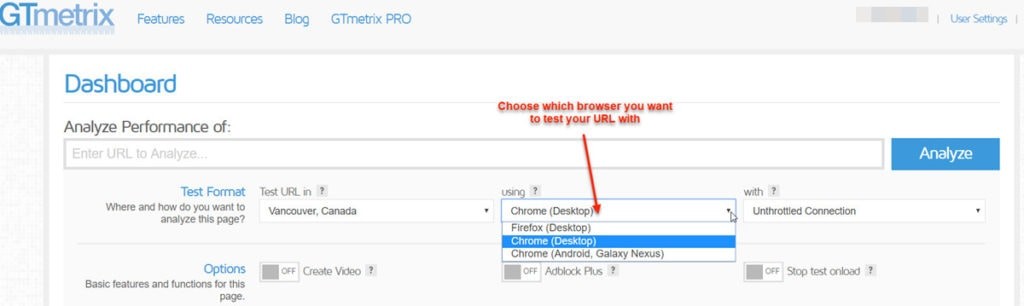
Browser Type
Next up you can choose which desktop or mobile browser is used to test the rendering of your URL:
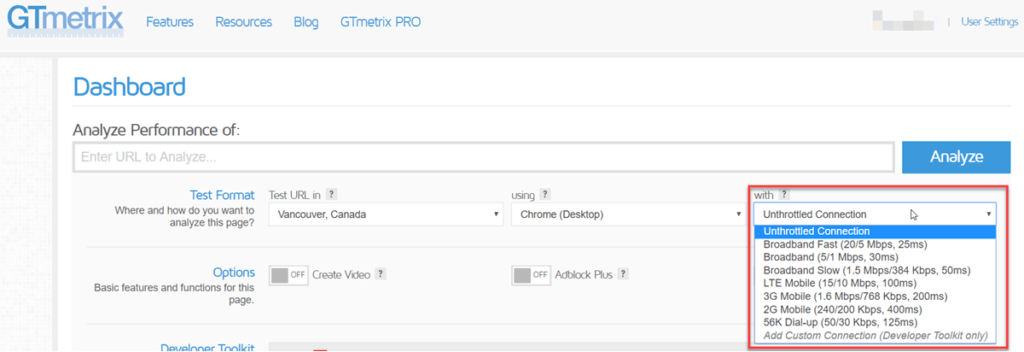
Connection Speed
You can also choose what connection speed the test should be conducted against e.g. 3G vs. Fast Broadband.
This is a critical setting if you’re testing how pages load and display on mobile devices:
There are also some additional test options you can toggle on or off:

- Create video – this generates a short video that shows exactly how your page loads, allowing you to identify components that might block or slow rendering
- Adblock Plus – you can use this setting to disable ads to assess how they impact your overall site speed
- Stop test Onload – GTmetrix tests default to waiting for 2 seconds of network inactivity before grading your site, which can sometimes skew result data. You can leave this disabled in most circumstances.
How To Read A GTmetrix Performance Report
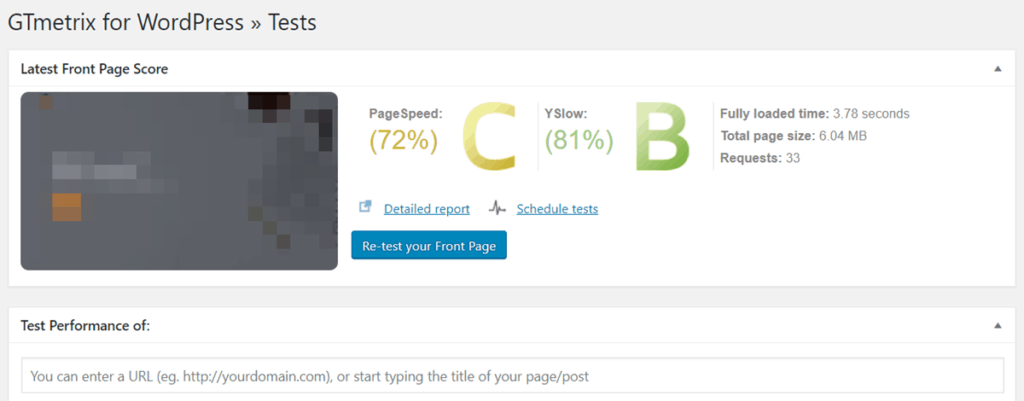
Let’s start from the top with the report dashboard – this is your “at a glance” overview of how your URL performed:
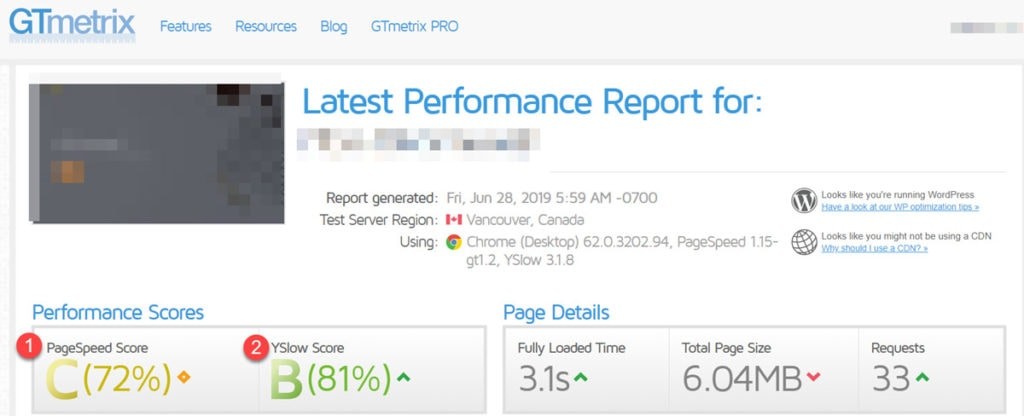
- PageSpeed – this is the grade your page receives based on Google’s metrics.
- YSlow – this is the grade your page received based on how Yahoo would score it.
In the above example, our PageSpeed score is 72% (C grade) so we have some work to do.
Our YSlow score is 81% (B grade) which isn’t perfect but we’ll probably only need to tweak things a little bit to get that closer to a 90% (A grade) rating.
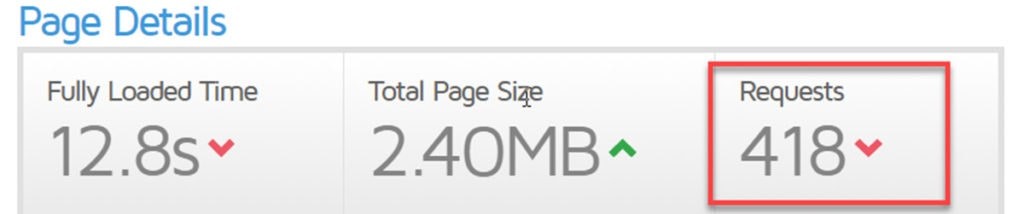
The next set of results we need to consider are ‘Page Details’:
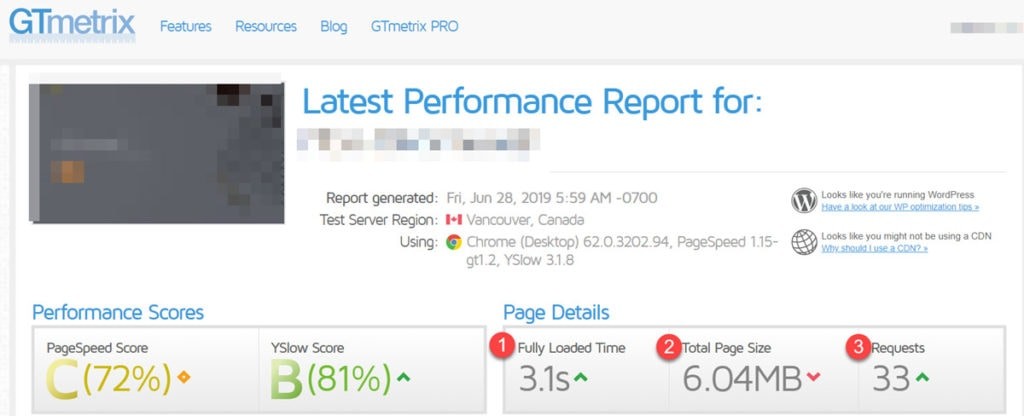
1. Fully Loaded Time
The length of time required for your page to become interactive in the test browser.
2. Total Page Size
The total amount of data downloaded to the test server, including all media assets such as images.
3. Requests
This the number of individual HTTP requests generated by your site via scripts, CSS, etc.
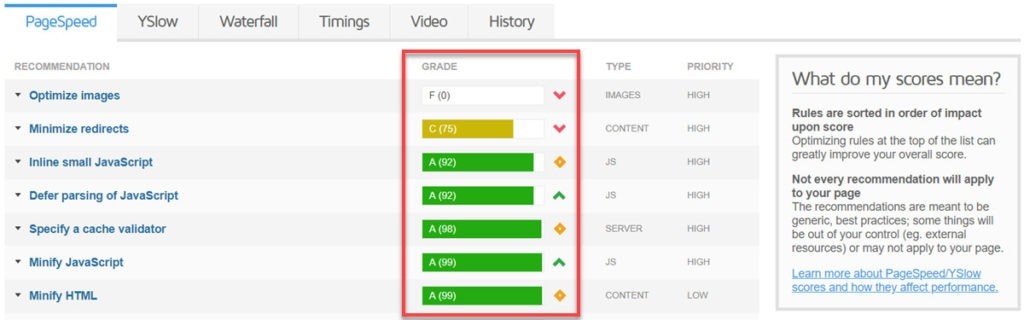
PageSpeed Recommendations
Now let’s take a look at the issues that have the highest impact on your page speed, and the steps you can take to remedy them.
Optimize Images
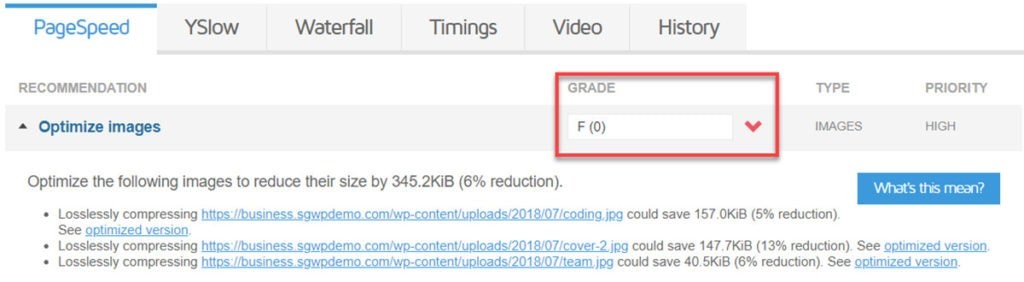
Images make up at least 60% of the total weight of a page, so unoptimized images are a primary cause of pages loading slowly.
As you can see we scored an F for this section, but we can fix this issue by using a plugin like Smush, or even better by using ShortPixel.
Serve Scaled Images

If you upload images that are too big or too small, then your theme and/or browser will attempt to resize them.
Doing this obviously causes that particular page to load more slowly.
So the trick is to serve scaled images that are “just right”.
Minimize Redirects
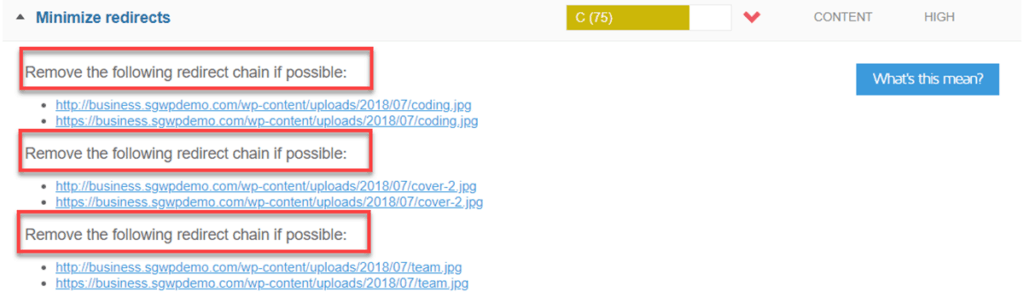
Redirects typically happen when you change the URL of a page, and you redirect the old page to the new one. If your site has dozens of redirects it can cause seriously impact your site speed.
The simple solution here is to avoid using redirects in the first place by learning best practices for URL structure.
If you already have a bunch of chain redirects, you can use a plugin like redirection to cut multiple redirects into a single one.
This one is important and will improve the quality of your internal linking structure and “link juice” is lost in long chain redirects.
Minify CSS and JS
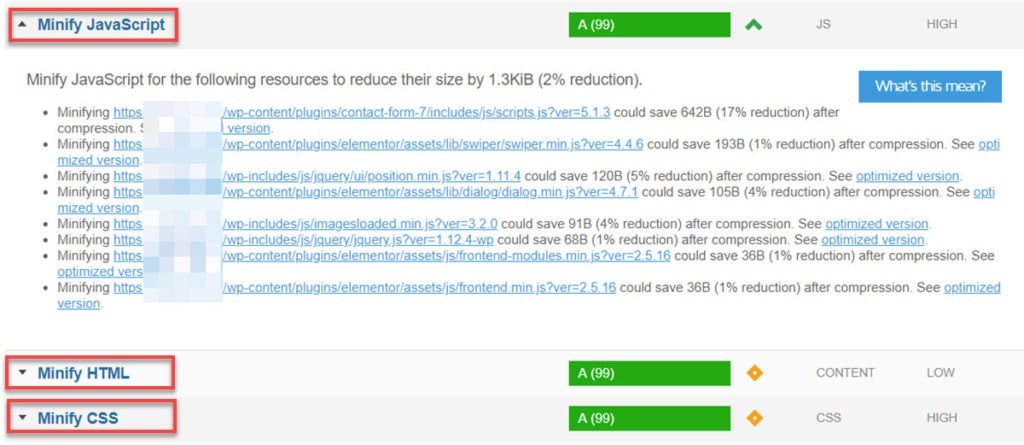
Minification basically means removing all the unused space left in code due to formatting. Even a blank space has a size in bytes, so minifying CSS, JavaScript and HTML files can reduce file size, boosting page speed in the process.
Most free caching plugins offer at least some minification functionality, but WP Rocket (review) or is the best of the paid options out there.
Note that if you don’t want / can’t use a caching plugin, Cloudflare also does minify CSS and Javacript on a CDN level.
Inline CSS and JS
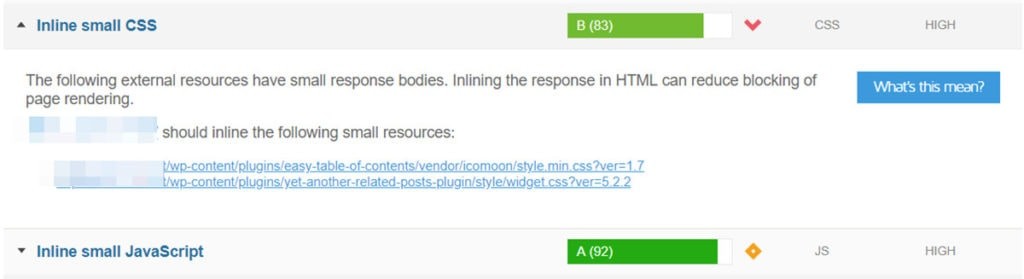
Best practice in optimizing site speed is typically to combine scripts from multiple pages into one single script that can then load asynchronously.
But if the scripts are made up of only a few lines of code, then it can sometimes make more sense to place them inline on the page.
So, if your score is really bad, have a dev move most of your inline CSS to your CSS stylesheet. But if it is still in the green, consider ignoring it, it doesn’t add much page load time anyway.
Defer Parsing Of JavaScript
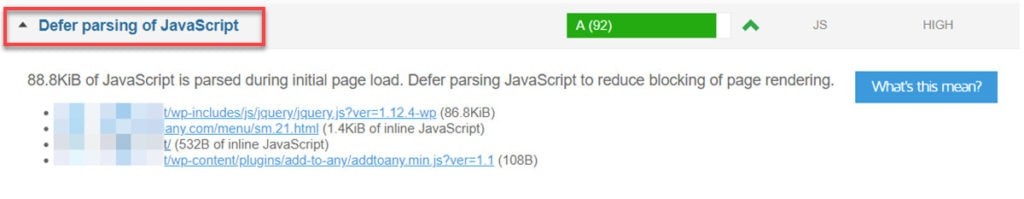
JavaScript requests are one of the main culprits for slow page load times. This is because all <script> elements have to be loaded before other page elements, even if it’s just your Google Analytics code.
This is known as “render blocking”. And it often caused by poorly coded Wordpress plugins.
You can fix this issue with the “Aggregate JS-files” feature in the excellent (and free) Autoptimize.
Leverage Browser Caching

Browser Caching is where the destination browser stores static content for a site locally – typically things like images or any other large assets.
This saves the browser from sending an HTTP request for them to a server.
You can implement browser caching with a free caching plugin like W3 Total Cache.
Some hosts like Siteground or Kinsta offer their own caching solution, so check first with your provider as their solutions are often custom tailored for their server setup.
Enable gzip Compression

This is a server-side way of making files smaller on the fly. Small files = faster page load times. Think of it like WinZip or WinRAR for your web server.
You can set up gzip compression yourself, have your web host do it, or use something like the Cloudflare CDN instead.
YSlow Recommendations
For this section, we’re going to focus only on metrics that are unique to the YSlow score because there’s a little bit of overlap here with PageSpeed.
Use a Content Delivery Network
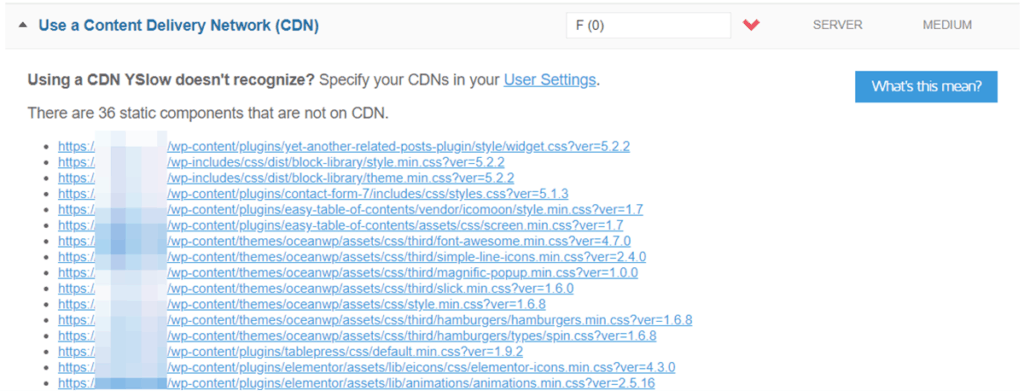
A Content Delivery Network basically stores a copy of your site on servers in different locations around the world.
Doing that ensures that somebody living in France doesn’t experience any perceptible delay when they view your content on a US-based server.
There are many CDNS out there right now, but Cloudflare is our favorite.
Add Expires Headers
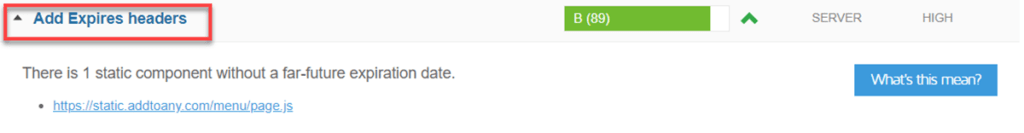
An ‘Expire Header’ is a tiny piece of code on your site that tells a server when to no longer use a cached version of the page and to load a new one instead.
These can make a lot of sense if you have content that doesn’t change dramatically or very often.
Note: Doing this incorrectly could “break” your theme so be careful.
Use Cookie-Free Domains

Cookies are small text files delivered to a visitors computer to either customize their viewing experience or to make sure you get credit for an affiliate sale, for example.
The more cookies that are delivered from your page, the slower it gets, which is reflected in this part of your YSlow score.
So it’s best practice to use cookie-free domains to optimize your site speed.
However, if you need to use cookies for services like Facebook ads, Google Analytics or others, do NOT cut them for the sake of site speed. It’s just not worth it.
Simply avoid over using them if you don’t really use the associated services.
Avoid HTTP 404 (Not Found) error
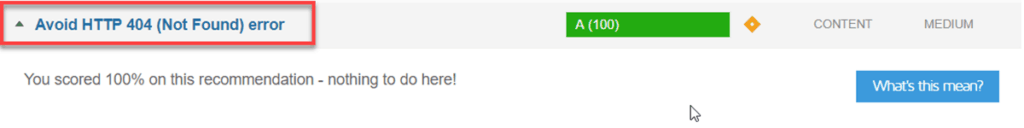
Site owners know that they need to avoid directing people to “broken” pages, but this happens to the best of us.
404s are a problem because they’re a server-generated response after a certain amount of time has elapsed attempting to load the missing page.
You can use a broken link checker plugin (not ideal), or the free version of Screaming Frog crawler to track down 404s on your site.
Reduce DNS Lookups
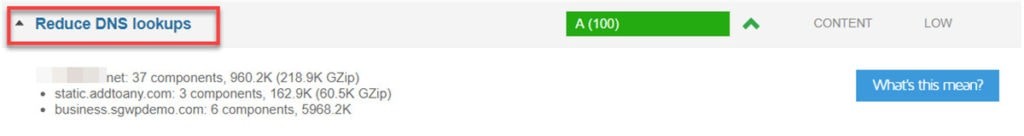
A DNS lookup is when your site has to query a DNS server to find the current IP address of a website.
A handful of DNS lookups isn’t an issue, but if your site is generating dozens, then this can cause problems with page speed.
If that’s the case for your site, then you’ll need to trim the number of DNS lookups your site generates.
Waterfall
This is a chart of every single request made by your site, including media files, JavaScript, CSS, etc.
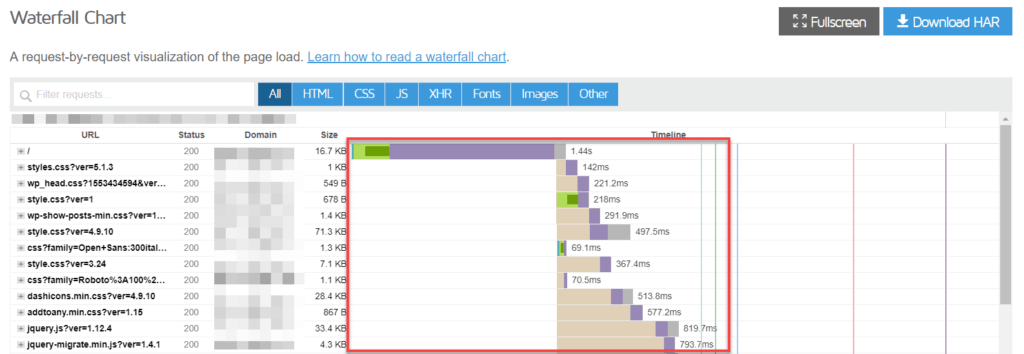
What’s great about the ‘Waterfall’ feature is that it takes the guesswork out of what might be slowing down your site.
You can see a visual representation instead, and in what order each request was executed.
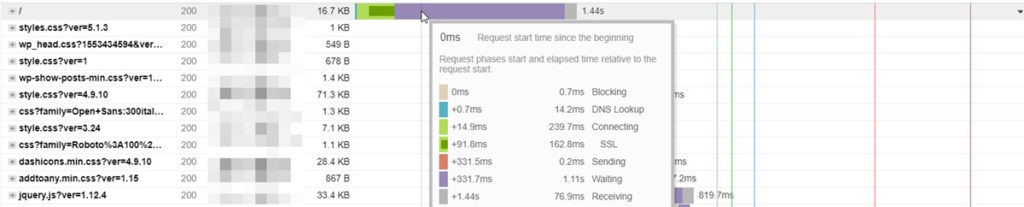
The color bands have the following meaning:
- Teal – DNS lookup
- Brown – Blocking
- Green – Connecting
- Red – Sending
- Purple – Waiting
- Gray – Receiving
In the above example, we can see that as the page loads the longest delays are after the SSL cert has loaded.
This might indicate a slow or shared server is in use.
Then if we scroll down a little further we can see large sections of brown:
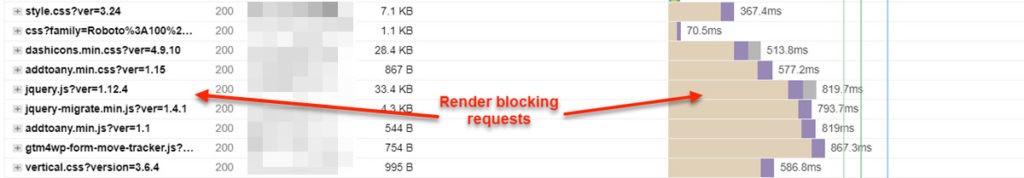
Each of these brown sections indicates that other page elements are unable to load until these JS and CSS elements have loaded.
So the easy solution to this particular problem is to defer parsing of both file types using the Autoptimize plugin, and to minify them with a caching plugin like WP Rocket. (Check our Autoptimize Vs WP Rocket comparison post)
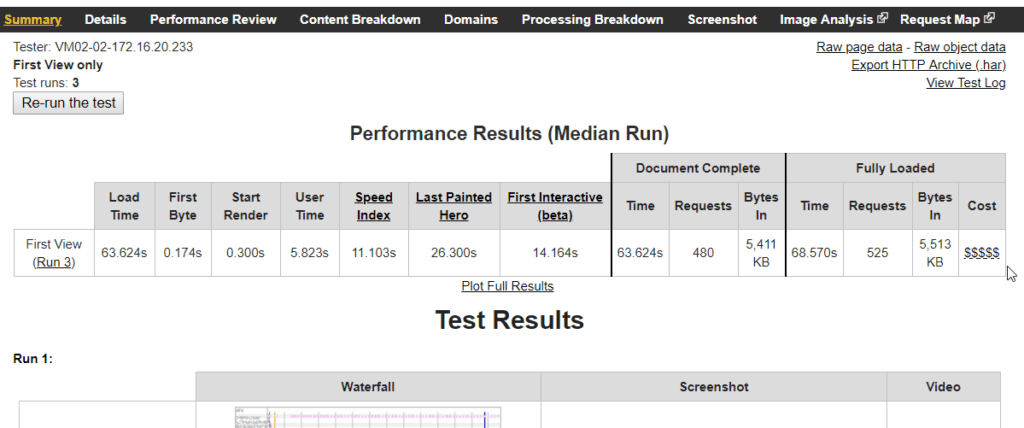
Timings
This is very similar to what you’d find in a typical Google PageSpeed result because of the terminology it uses i.e. “Contentful Paint”.
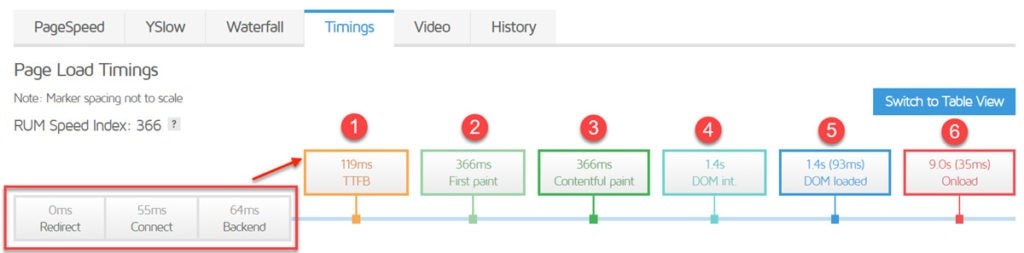
- So, as you can see the server hands over the first byte of data (Time To First Byte) to the browser after 119ms.
- The ‘First Paint’ then takes place after 366ms – this is the time taken to render any page of the page in the browser.
- The “First Contentful Paint” takes places at the same time, so the user is already starting to see some site content.
- After 1.4s the DOM (Document Object Model) has loaded so all scripts will begin to load.
- The site should now be fully loaded (Onload) after 9.0 seconds.
The important score to pay attention to here is the “Onload” time because it indicates that the site design is overly complex and/or there are dozens of HTTP requests generated by multiple JS files.
418 of them, to be exact.
Yes, there’s a difference of almost 4 seconds between ‘Onload’ time and ‘Fully Loaded Time’ because GTmetrix now waits for 2 seconds of network inactivity before calculating the ‘Fully Loaded’ score.
And you also have to factor in that the ‘Onload’ trigger sometimes misses some events, which accounts for the other 1.8 seconds.
GTmetrix Alternatives
So, you’re looking for something a little different to GTmetrix?
Here are a few options for you to check out.
Pingdom

Pingdom is ideal if you want to not only run in-depth speed tests, but also need active monitoring of your site(s).
It’s a paid service, but you can get a free trial without having to use a credit card.
Google PageSpeed Insights

This is an excellent free tool from Google for running site speed tests – the speed testing for mobile devices alone is well worth a look.
Visually this tool has come a long way in the last 12 months.
Web Page Test
Web Page Test is an oldie but a goodie, and still very popular with SEOs and site designers. It includes a waterfall feature similar to the one in GTmetrix and the TraceRT function is also pretty cool.
And lastly, you could also use the basic speed testing functions found in Google Analytics:
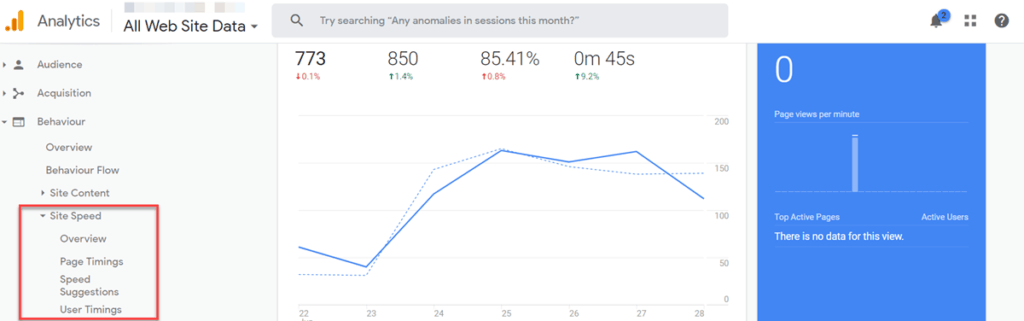
The data you find here are interesting because they give you a clear indication of page speed results across multiple devices, around the world.
Conclusion
We really hope you enjoyed our tour of GTmetrix, and that you have a better appreciation of just how much data this tool actually gives you, free of charge to boost your site’s performance.
Let us know in the comments below if you managed to improve your site speed with any of the tips you found in this post!